What Is a Chart?
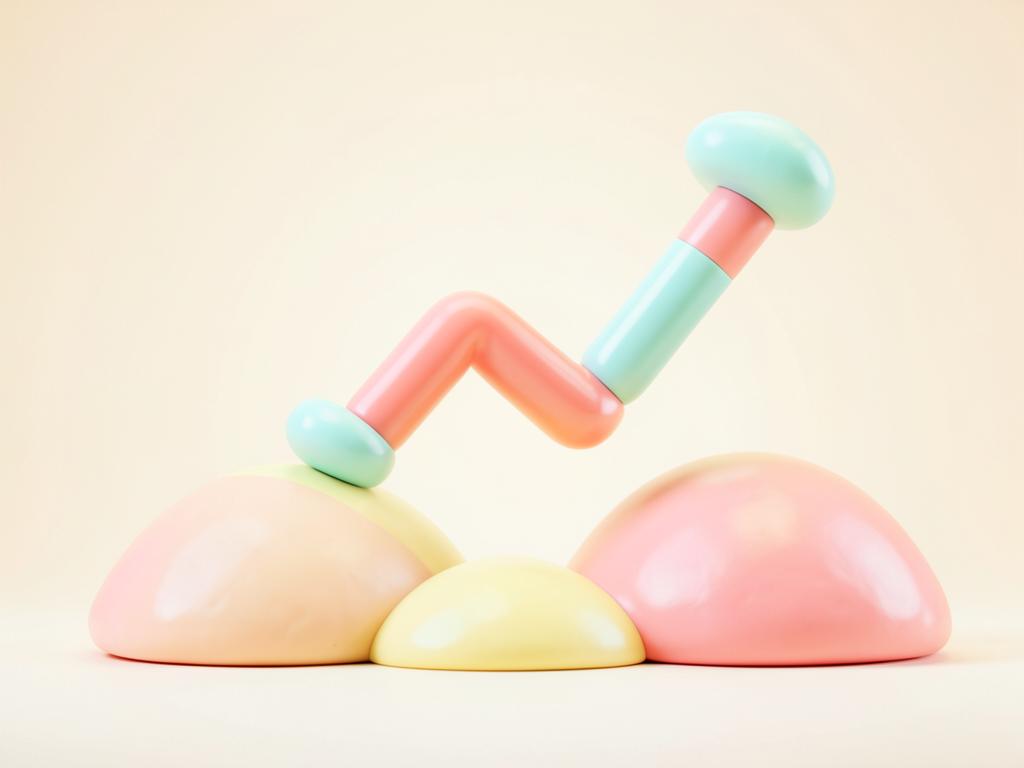
A picture of price going for a walk
▸ Story
Imagine you and your child go for a walk and draw a line on a map. Every minute, you mark where you are.
When you walk uphill, the line goes up. When you walk downhill, the line goes down. When you walk along a flat path, the line goes sideways.
A price chart is like that—but instead of your feet, it's the price moving.
Time goes along the bottom. Price goes up and down on the side. The line shows where price has been.
When you look at a chart, you're asking: “Has price been walking up, down, or sideways?” “Where did it stop and turn around?” “What might it do next?”
You're not trying to be a wizard. You're just reading the walk the price has taken.
★ Key idea
A chart = “A picture of price walking over time.”
✦ Quick quiz
1. In the walk story, what does the line do when we go uphill?
2. On a price chart, if the line keeps going up, what does that mean?
3. When we look at a chart, what are we really trying to see?
📘 Read more
Wild and Wise
A friendly book for building confidence and smart thinking, one page at a time.